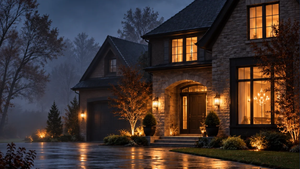
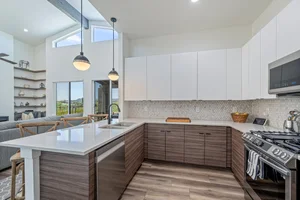
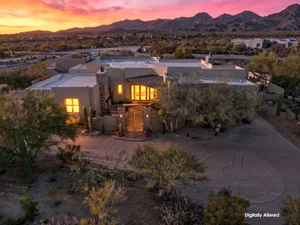
In the Tucson luxury segment, average price per square foot has risen 120% over three years, reaching $481 to $523 for homes above $500,000. At the same time, 43% of all Oro Valley listings took a price reduction in August 2026, and the average property now sits on market for 84 days before closing. Both numbers are accurate. Both describe the same market.
The Oro Valley real estate market in 2026 divides clearly at one threshold: $500,000. Below it, median prices are softening and inventory is building. Above it, specific price tiers are still moving efficiently, out-of-state buyer demand from California, Washington, and Texas remains active, and the properties that close at or near asking price share a consistent characteristic: they were priced precisely and marketed professionally before the first day on market.
For owners of $500K+ homes in Oro Valley, the Catalina Foothills, Dove Mountain, and surrounding premium communities, the data tables below provide a granular picture of where the market stands, what a 1.59-point difference in sale-to-list ratio is worth in real dollars, and what the research says about the conditions under which luxury listings reach their full value.
Oro Valley Real Estate Market: Luxury Tier Performance by Price Band
The January 2026 MLSSAZ and Tucson Association of Realtors data provides the most granular tier-by-tier breakdown of luxury home performance available for Southern Arizona. The table covers every price band from $500K through $1.4M+: closed sales volume, year-over-year change, median days on market, and close-to-ask ratios.
| Oro Valley / Tucson Luxury Market: Sales Performance by Price Tier, January 2026 | ||||
|---|---|---|---|---|
| Price Band | Jan ’26 Sales | YoY Change | Median DOM | Close-to-Ask |
| $500K–$599K | 89 | +9.9% | 50 days | -1.91% |
| $600K–$699K | 39 | -18.8% | 30 days | -1.66% |
| $700K–$799K | 21 | -43.2% | 30 days | -3.21% |
| $800K–$999K | 26 | -16.1% | 47 days | -3.25% |
| $1M–$1.19M | 11 | -8.3% | 33 days | -2.71% |
| $1.2M–$1.39M | 10 | +42.9% | 14 days | -3.34% |
| $1.4M+ | 14 | -33.3% | 22 days | -7.70% |
Source: Tucson Association of Realtors / MLSSAZ Luxury Market Report, January 2026; Oliver Realty Tucson Real Estate Forecast, July 2026
Two tiers stand apart. The $500K–$599K band posted 9.9% sales growth year-over-year, the only tier below $1.2M to record positive volume in the January 2026 dataset. The $1.2M–$1.39M tier is the most active in the full MLSSAZ dataset: a 42.9% surge in closed sales with a median days on market of just 14 days, which suggests a well-qualified buyer pool moving decisively when the right property appears.
For sellers in the $700K–$999K range, where volume has declined 16% to 43% year-over-year, the picture is more nuanced. Every property that did close in those tiers in January 2026 did so in 30 to 47 days. The gap between the homes that sold and those still accumulating days on market is not market conditions; it is pricing precision, presentation quality, and access to the buyer pool most likely to pay full value.
What the Oro Valley Market's Sale-to-List Ratio Costs Sellers
The August 2026 Oro Valley market-wide sale-to-list ratio sits at 97.4%, per the Arizona Homes and Condos August 2026 market report. That means the average seller closes 3.1% below asking price. On a $1 million home, that gap is $31,000. The table below translates the difference between the market average and a consistently higher-performing ratio into actual seller proceeds at each price point.
| Sale-to-List Ratio Impact: What 1.59 Points More Means at Each Price Point | |||
|---|---|---|---|
| List Price | At 97.4% (Oro Valley Market Avg., Aug 2026) |
At 98.49% (Oliver Realty Avg.) |
Additional Seller Proceeds |
| $500,000 | $484,500 | $492,450 | +$7,950 |
| $700,000 | $678,300 | $689,430 | +$11,130 |
| $900,000 | $872,100 | $886,410 | +$14,310 |
| $1,200,000 | $1,162,800 | $1,181,880 | +$19,080 |
| $1,500,000 | $1,453,500 | $1,477,350 | +$23,850 |
Sources: Arizona Homes and Condos, August 2026 (97.4% market average); Oliver Realty verified transaction data, 1,100+ sales (98.49% average)
Oliver Realty's 98.49% average sale-to-list ratio is documented across more than 1,100 verified transactions, with an average sale price of $681,016 and a 48-day average close versus the 56-day market average. That performance is not the product of favorable market timing. It is the direct output of the Oliver Selling Solution: a systematic pre-listing process that combines data-driven pricing calibration with professional staging, cinematic photography, drone footage, 3D tours, and targeted marketing to the out-of-state buyer pool that drives the highest offer competition in this segment.
The Oliver Selling Solution: Pre-Listing Investment and Seller Outcomes
Each component of a professional listing package has a documented impact on seller outcomes. The table below shows what industry-level research says about the ROI of the tools that define premium real estate marketing – the same tools built into every Oliver Realty listing through the Oliver Selling Solution.
| Pre-Listing Marketing Investment vs. Seller Outcome (Luxury Tier) | ||||
|---|---|---|---|---|
| Marketing Element | Typical Investment | Impact on Days on Market | Impact on Sale Proceeds | Source |
| Professional Photography | $300–$600 | 32% faster sales | 61% more online views | Redfin / VHT Studios |
| Drone / Aerial Photography | $200–$400 add-on | 68% faster sales | Higher offer competition | MLS data via Inman |
| Cinematic Video Tour | $400–$800 | Faster first-week velocity | 403% more inquiries vs. photo-only | NAR 2025 |
| 3D Virtual Tour (Matterport) | $150–$400 | 31% less time on market | 95% of buyers more likely to call | Matterport 2025 |
Sources: NAR 2025 Profile of Home Staging; Redfin / VHT Studios; Inman MLS Data Analysis; Matterport 2025 Real Estate Photography Statistics
According to NAR's 2025 Profile of Home Staging, 29% of sellers' agents reported a 1% to 10% increase in the dollar value offered when a home was staged, and 49% observed a reduction in time on market. A 1% improvement on a $900,000 Oro Valley property is $9,000 in additional seller proceeds.
When to List: Seasonal Selling Performance in the Oro Valley Real Estate Market
Listing timing in Arizona is not a minor variable. Buyer activity follows a documented seasonal pattern, and the difference between the strongest and weakest selling months in this market represents meaningful variation in days on market and sale-to-list performance. The table below shows how those numbers shift across the calendar year.
| Arizona Luxury Home Market: Seasonal Selling Performance (2026 Data) | ||||
|---|---|---|---|---|
| Season / Period | Avg. Days on Market | Sale-to-List Ratio | Market Condition | Seller Takeaway |
| January–February | 34–42 days | 98.5–98.9% | Peak seller season | Highest velocity; strongest offers |
| March–April | 38–50 days | 98.0–98.5% | Active | Strong buyer demand; competitive |
| May–June | 50–65 days | 97.5–98.0% | Transitioning | Pre-summer softening begins |
| July–August | 65–84 days | 96.9–97.2% | Buyer-favorable | Longest DOM; 43% of listings cut price |
| September–October | 55–70 days | 97.0–97.5% | Recovering | Buyer activity returns post-summer |
| November–December | 60–75 days | 96.5–97.0% | Slower | Motivated buyers; limited listing competition |
Sources: Oliver Realty Arizona Selling Guide 2026; Arizona Homes and Condos Market Report, August 2026; Tucson Association of Realtors
February is the highest-performance month in the Arizona seller calendar, averaging 34 days on market and a 98.9% sale-to-list ratio based on Oliver Realty's historical transaction data. That is a 2-point performance difference compared to the August trough. On a $1.2 million property, that 2-point difference in sale-to-list ratio represents approximately $24,000 in additional seller proceeds.
For Oro Valley sellers evaluating their timing now, fall 2026 is the preparation window: the period to complete pre-listing improvements, engage staging, and schedule photography so a listing can launch during the market's most competitive buyer environment. The Oliver Selling Solution is designed to compress those pre-listing timelines without sacrificing presentation quality or pricing calibration.
Tucson's Premium Communities: A Neighborhood-Level Pricing Comparison
Broad Oro Valley market averages mask meaningful variation between communities. The Catalina Foothills, North Tucson, Dove Mountain, and Tanque Verde Valley each follow distinct pricing dynamics, with different supply constraints, buyer profiles, and appreciation trajectories. The table below maps key 2026 benchmarks across Oliver Realty's core service areas.
| Tucson Luxury Community Real Estate Comparison, 2026 | |||||
|---|---|---|---|---|---|
| Community | Median Price | Avg. $/Sq. Ft. | Median DOM | YoY Price Change | Market Posture |
| Catalina Foothills | $850K–$900K+ | $268–$300 | 60–75 days | +11.4% | Seller Advantage |
| North Tucson | ~$565K | ~$280 | ~50 days | +22.7% vol. YoY | High Activity |
| Oro Valley | $540K–$580K | $268 | 75 days | +4.7% | Balanced |
| Dove Mountain | $650K+ | ~$287 | 74–84 days | Stable | Balanced |
| Tanque Verde Valley | $720K+ | ~$280 | ~70 days | Stable | Balanced |
| Tucson Metro (Broad) | $319K–$325K | $209–$232 | 65 days | -1.6% | Buyer Lean |
Sources: Oliver Realty Market Intelligence, March 2026; MLSSAZ / TAR; Redfin 2026; Luxury Signature Group, April 2026
The Catalina Foothills posted 11.4% year-over-year price appreciation against a land supply that cannot expand, with most parcels zoned at one home per acre and no significant new development available. That structural scarcity creates a pricing floor that market cycles do not easily erode. Oro Valley's 4.7% appreciation reflects steady, fundamentals-driven demand, particularly among buyers relocating from California, Washington, and Texas, which Redfin identifies as the three largest sources of net inflow to the Tucson market in Q1 2026.
Those out-of-state buyers, who arrive with equity from higher-cost markets and are often rate-insensitive, represent the most qualified offer pool in this segment. Reaching them requires marketing that extends beyond the local MLS.
Maximum Sale Price Is a Process, Not a Prediction
The 2026 Oro Valley real estate market does not move uniformly. It rewards sellers whose pricing is calibrated to their specific tier, whose listing launches with full professional marketing, and whose agent has consistent access to the out-of-state buyer pool that drives the highest offers in this segment. The data in this piece points to the same conclusion from five different angles: the gap between what a $500K+ home could sell for and what it actually does is almost always a function of strategy, not market conditions.
Oliver Realty's 98.5% average sale-to-list ratio, $681,016 average sale price, and 48-day average close are the outputs of the Oliver Selling Solution applied consistently across 1,100+ verified transactions in Oro Valley, the Catalina Foothills, Dove Mountain, and surrounding premium communities.
To find out what your home is worth and what a data-backed selling strategy could return, request a complimentary home valuation below.
Sources
Arizona Homes and Condos Realty. Oro Valley Arizona Real Estate Market Report: August 2026. https://arizonahomesandcondos.com/oro-valley-arizona-real-estate/
Oliver Realty. Tucson Real Estate Forecast: 2026 Market Data. https://oliverrealty.net/blog/2026/7/21/tucson-real-estate-forecast-2026-market-data
Oliver Realty. The Top Real Estate Brokerages in Catalina Foothills of 2026. https://oliverrealty.net/blog/2026/5/26/the-top-real-estate-brokerages-in-catalina-foothills-of-2026
Oliver Realty. What Is the Best Time to Sell a House in Arizona in 2026? https://oliverrealty.net/blog/best-time-to-sell-house-arizona
Tucson Association of Realtors / MLSSAZ. Luxury Buyer Demand Report and Luxury Inventory Report, January 2026. Via Oliver Realty Market Intelligence, March 2026.
DDH Home. Home Staging Statistics: 2026 Data (3,000+ Transactions, Jan 2024–Dec 2025). https://ddh-home.com/most-important-home-staging-statistics/
Real Estate Staging Association (RESA). Q3 2025 Industry Staging Data. Via DDH Home 2026 Study.
National Association of Realtors (NAR). 2025 Profile of Home Staging. https://www.nar.realtor/press-releases/nar-report-reveals-home-staging-boosts-sale-prices-and-reduces-time-on-market
Redfin / VHT Studios. Professional Photography Impact on Home Sales. Via sevenroadsrealestate.com
Inman / MLS Data Analysis. Aerial Photography and Home Sale Speed. Via rubyhome.com/blog/real-estate-photography-stats/
Matterport. Real Estate Photography Statistics 2025. https://matterport.com/learn/real-estate-photography/stats
Luxury Signature Group (Brandon Thompson). Oro Valley Luxury Real Estate Market Guide for Buyers & Sellers, April 2026. https://luxsignature.com/blog/oro-valley-luxury-market-guide-for-buyers-and-sellers
Redfin. Q1 2026 Migration Data: Top Sources of Net Buyer Inflow to Tucson. Via Oliver Realty Tucson Real Estate Forecast, July 2026.