Oliver Realty · Market Report · October 2026
Tucson luxury inventory, prices and market conditions, plus a seven-brokerage analysis of listing time and median price retention.
Luxury inventory
5.6 mo
$1M+ market, August 2026
August closings
+43%
Year over year, $1M+
Closings over 120 DOM
2.27%
Oliver Realty, lowest of seven exports
List-to-sold spread
0.47%
Oliver Realty, smallest of seven exports
Get every chart, note and source in the full report.
Download the full report (PDF)When a Tucson luxury home sits on the market, the number of days tells only part of the story. Sellers need to know how often listings extend beyond four months, how closely sold prices track list prices and how conditions change above $2 million. A citywide average can hide those differences. This report looks at the current $1 million-plus market, then compares results in seven supplied brokerage exports.
Oliver Realty compiled two datasets. The Tucson luxury figures cover residential properties priced at $1 million and above through August 2026. The seven MLSSAZ brokerage exports were prepared on September 25, 2026 and contain 6,834 closed single-family records from searches beginning January 1, 2026. Their September 25, 2026 end date is an upper search boundary; the exports contain only records available when they were generated in 2026. Some reports are office-level and others are company-level, so the comparison applies only to these seven datasets. MLSSAZ publishes regional sales, inventory, pricing and days-on-market statistics.
Tucson Luxury Housing Snapshot: August 2026
Tucson’s $1 million-plus market was balanced in August, with a clear split at $2 million. Active inventory fell from the prior year, monthly closings increased and total inventory dropped to 5.6 months.
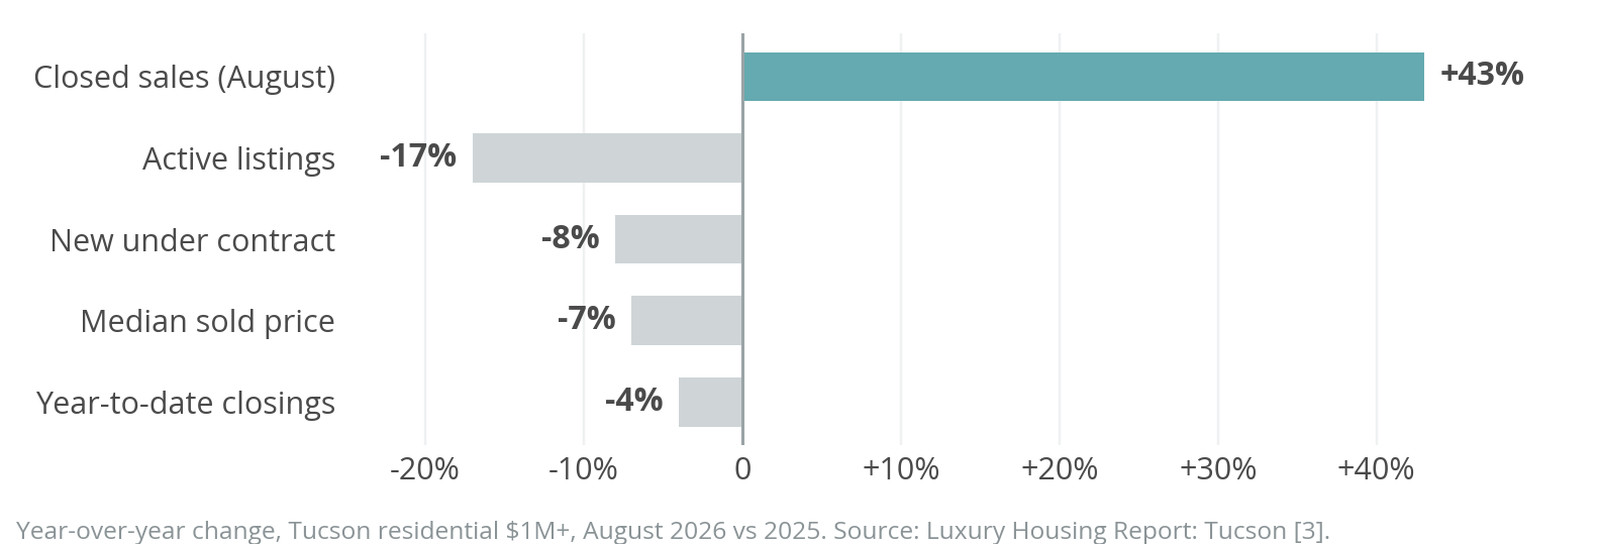
Fewer active listings and more August closings tightened supply, while year-to-date sales remained behind 2025. Results still varied by price band.
Market Conditions by Price Band: August 2026
The $1 million-plus market was balanced as a whole, but supply jumped at $2 million. Properties below that threshold had about four months of inventory. The $2 million-plus tier had 19 months.
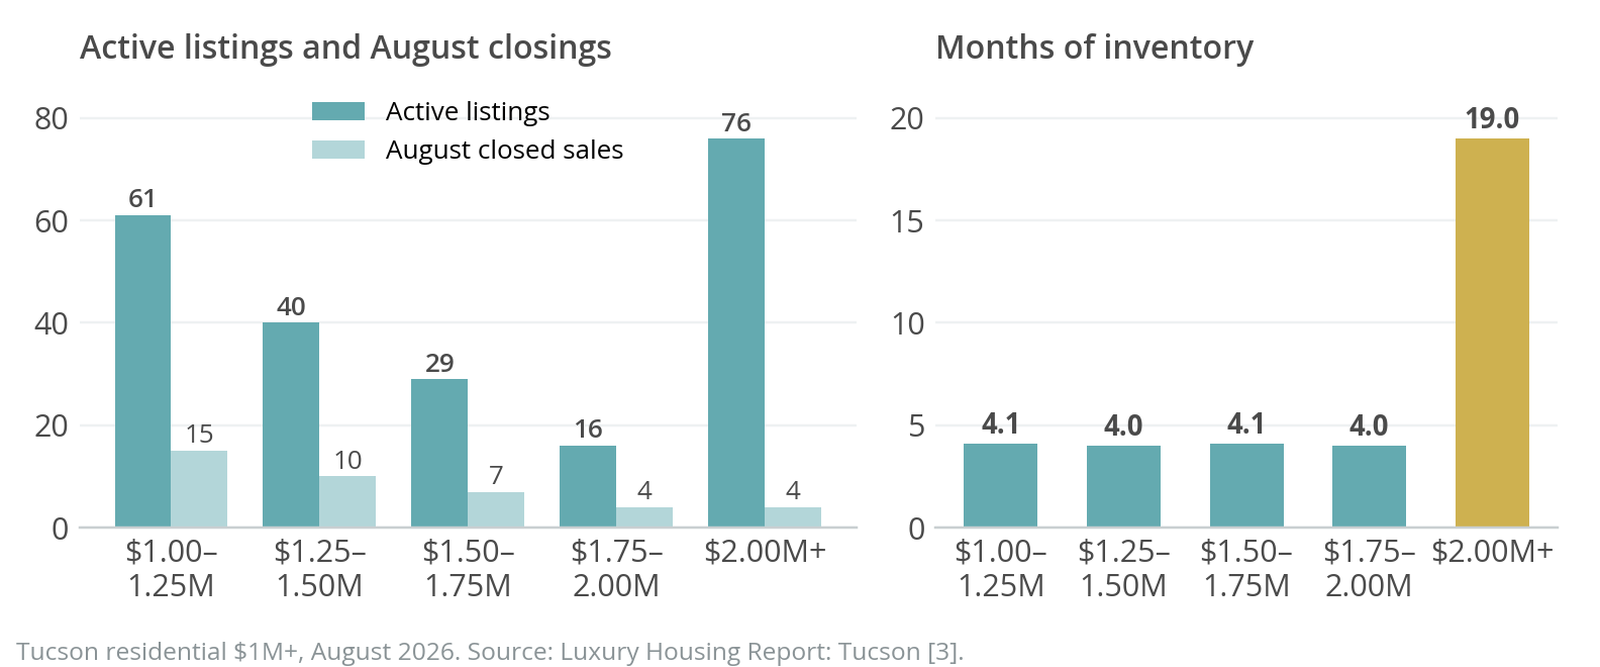
Below $2 million, supply favored sellers more than the marketwide 5.6-month figure suggests. Above $2 million, 76 active listings competed for four August closings. Sellers in that tier face a smaller buyer pool, so direct competing listings matter more than Tucson’s overall luxury median.
Part 2 · Seven supplied brokerage exportsLong-Tail Share Among the Seven Exports
A small group of slow sales can pull an average upward. We compared the share of reported closings with more than 120 days on market (DOM). The measure covers closed listings only. It excludes active, expired and withdrawn listings, and it uses DOM rather than cumulative days on market (CDOM).
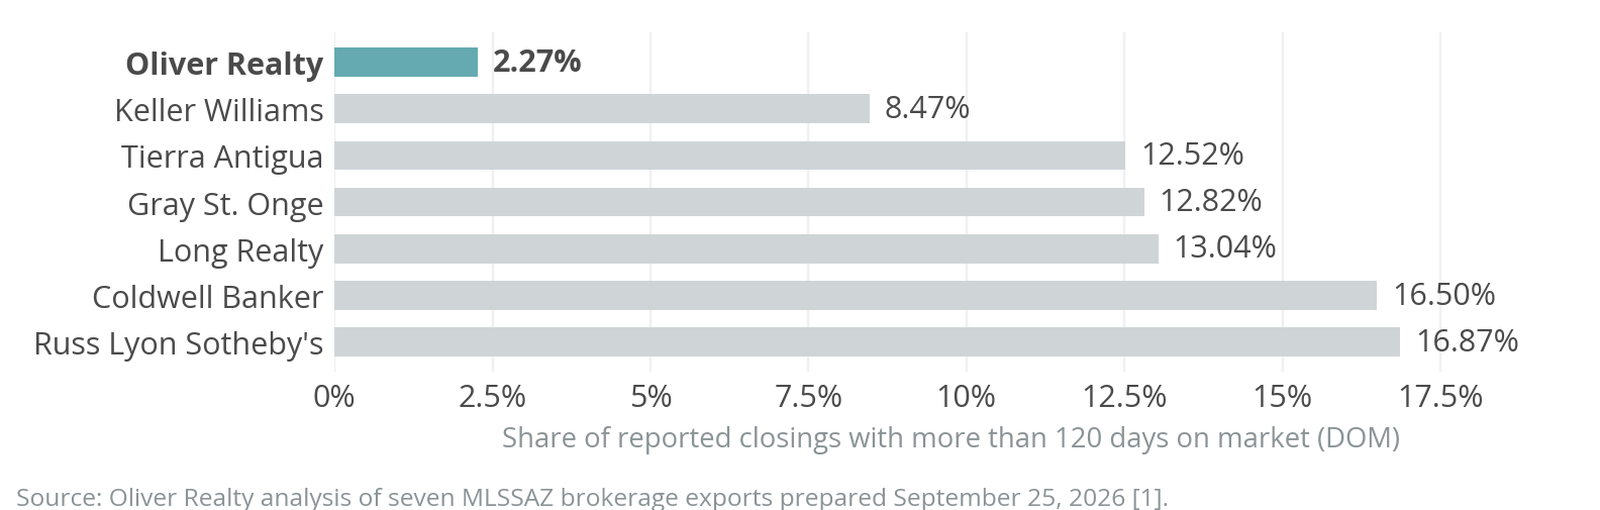
Oliver Realty had the smallest DOM long tail in the supplied data. Of its 44 reported closings, 43 fell within 120 DOM. Its 97.73% rate was 6.20 percentage points above the next result. The same export places four Oliver closings in the 121+ CDOM category. This ranking measures DOM alone and leaves total marketing time unmeasured. Gray St. Onge had the lowest average DOM at 44 days.
A low average and a small long tail are different measures. Oliver’s reported closings were more concentrated below 121 DOM, but the exports do not explain why. Property mix, sample size and brokerage practices may all affect the result. The Oliver Selling Solution explains how the team prices and presents Tucson homes.
Median List-to-Sold Price Spread
We calculated the difference between each export’s median list price and median sold price, then divided it by the median list price. We calculated each median on its own, so the figure differs from a transaction-level sale-to-list ratio. “List Price” also differs from “Original List Price,” so the spread does not include earlier price reductions.
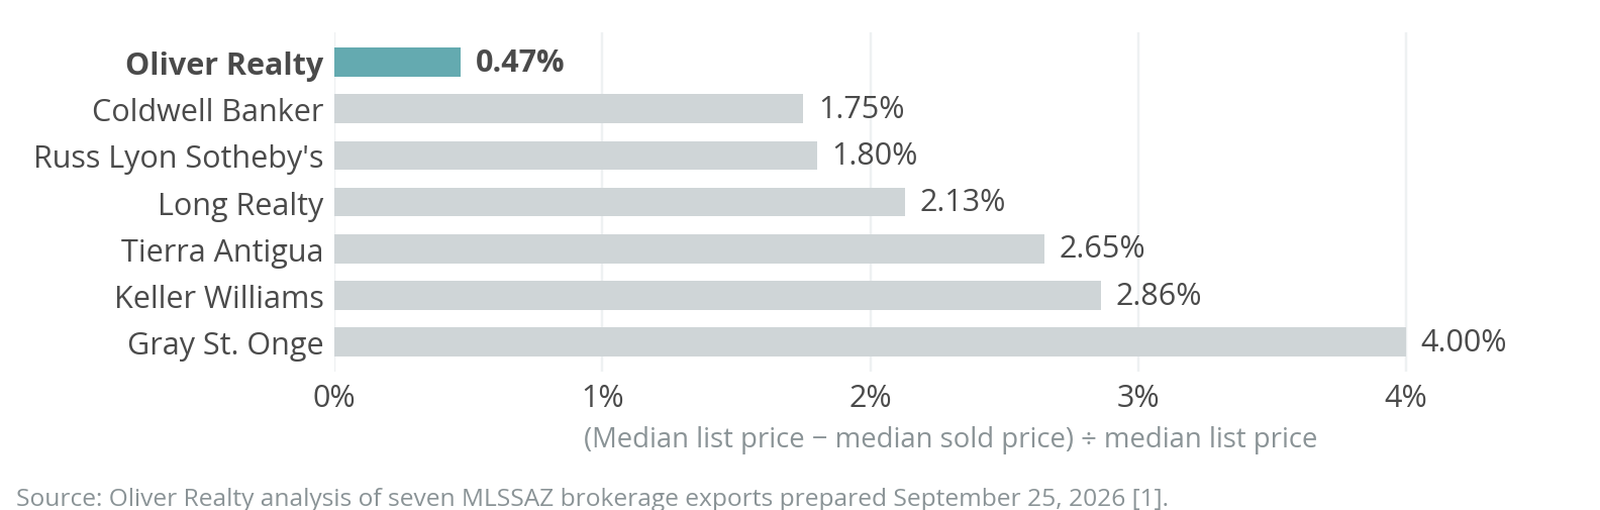
Oliver Realty had the smallest spread: $3,750, or about 0.47% of its median list price. Coldwell Banker Realty was next at 1.75%. This does not mean every Oliver listing sold within 0.47% of its asking price. Each median summarizes its own dataset, so the comparison shows how closely the middle of each sold-price distribution tracked the middle of its list-price distribution.
Sold-Price Context in the Seven Exports
Price mix changes the comparison. A brokerage handling larger or more specialized homes may face a smaller buyer pool and a different sales timeline.
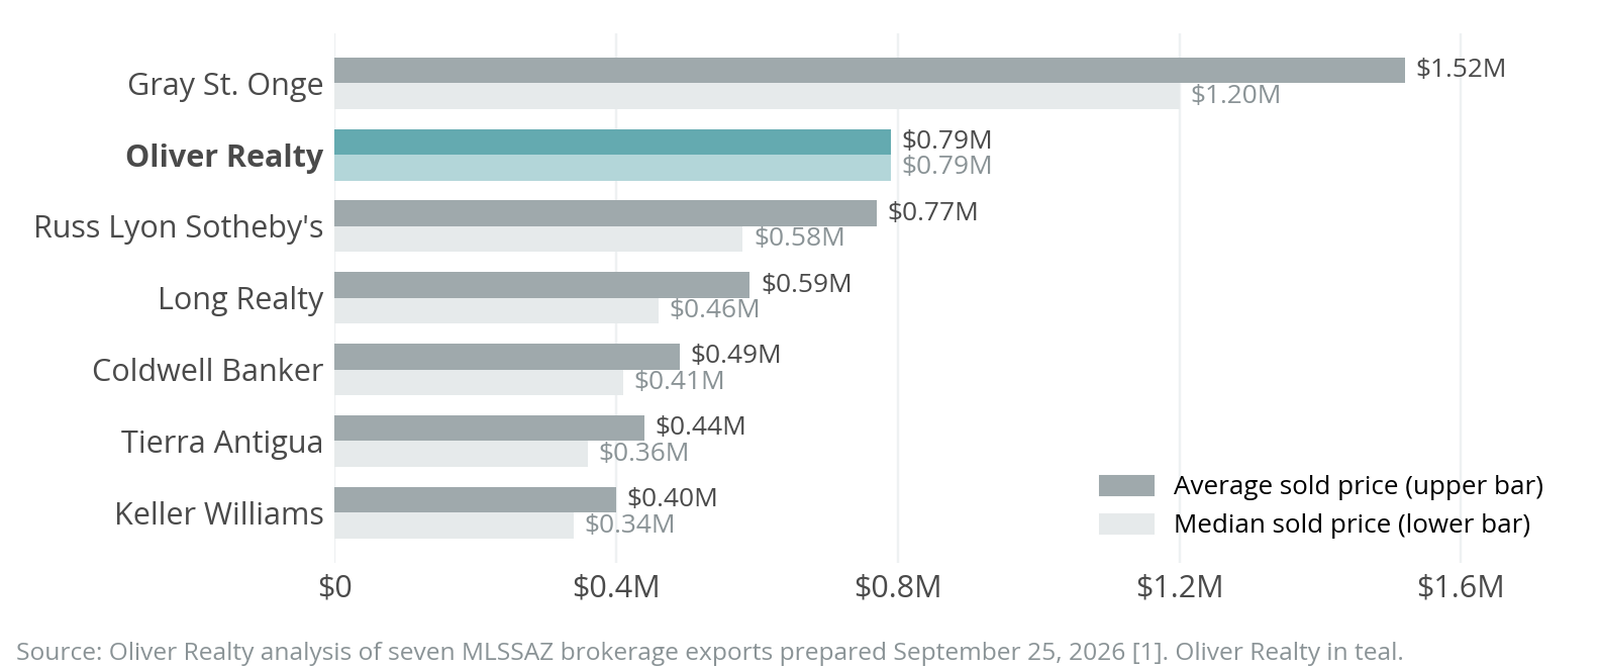
Oliver Realty ranked second for average sold price, median sold price and average sold price per square foot. Its dataset paired high transaction values with the lowest share of reported closings above 120 DOM.
Sample sizes differ by a large margin. Oliver Realty reported 44 closings, while the largest company-level exports contained more than 2,500. The figures describe each brokerage’s reported transaction mix. They do not show how the same home would perform with each company.
Market time means something different in each price band. Oliver Realty’s low share of 121-plus-DOM sales applies to the completed transactions in its export alone. It excludes active, expired and withdrawn listings. The price-band data shows why each home still needs its own pricing and marketing plan. Oliver’s broader Tucson luxury positioning focuses on homes starting around $500,000 in communities including the Catalina Foothills, Oro Valley and Dove Mountain.
Selling a Tucson luxury home? Compare these figures with your property’s price band and competing listings.
Sources
- Oliver Realty Original Research, Seven Supplied Brokerage Exports Analysis, October 2026. Compiled from MLSSAZ exports prepared September 25, 2026.
- Tucson Association of REALTORS®, MLSSAZ Statistics Library, accessed October 2026. https://www.tucsonrealtors.org/mlssaz-statistics/
- The Luxury Housing Report: Tucson, September 2026, using MLSSAZ data obtained September 8, 2026. Long Realty Luxury Housing Report: Tucson
- Oliver Realty, Tucson Luxury Real Estate, accessed October 2026. https://oliverrealty.net/lifestyle/tucson-real-estate
- Oliver Realty, February 2026 Tucson Luxury Real Estate Report, accessed October 2026. https://oliverrealty.net/blog/tucson-luxury-market-report-february-2026